| Financial indicators | 2019 | 2018 | 2017 | % Chge. |
|---|---|---|---|---|
| Total revenue | $5,794,455,671 | $5,152,971,813 | $4,136,664,162 | 12.4% |
| Net Operating Income (NOI) | $4,701,411,419 | $4,152,300,948 | $3,253,648,135 | 13.2% |
| EBITDA | $3,946,758,448 | $3,426,031,863 | $2,681,914,156 | 15.2% |
| Net profit | $4,104,766,090 | $3,891,797,290 | $5,166,261,356 | 5.5% |
| FFO | $3,561,563,983 | $3,170,877,173 | $2,649,533,679 | 12.3% |
| AFFO | $3,900,564,424 | $3,710,327,975 | $3,339,320,043 | 5.1% |
| AFFO per CBFI with economic rights | $2.76 | $2.68 | $2.53 | 2.8% |
| Distribution to holders of CBFIs | $3,496,063,839 | $3,322,529,464 | $3,015,422,488 | 5.2% |
| CBFIs with economic rights | 1,415,410,461 | 1,384,387,277 | 1,322,146,046 | 2.2% |
| Distribution per CBFI with economic rights | $2.47 | $2.40 | $2.28 | 2.9% |
FFFO = Flow from Operations
AFFO = Adjusted Flow from Operations
| Balance sheet data | 2019 | 2018 | 2017 | % Chge in bp |
|---|---|---|---|---|
| Cash and cash equivalents and restricted cash | 490,355,748 | 1,808,607,828 | 3,088,324,660 | -72.9% |
| Recoverable tax, mainly income tax | 84,514,506 | 37,599,750 | 2,304,907 | 124.8% |
| Investment properties | 64,364,614,588 | 62,716,149,554 | 60,371,665,765 | 2.6% |
| Total assets | $65,447,797,171 | $65,048,955,871 | $63,985,768,434 | 0.6% |
| Total debt | 5,650,000,000 | 6,500,000,000 | 6,500,000,000 | -13.1% |
| Total liabilities | $7,749,222,496 | $8,840,851,982 | $9,035,500,497 | -12.3% |
| Total stockholders’ equity | $57,698,574,675 | $56,208,103,889 | $54,950,267,937 | 2.7% |
| Loan to value | 8.6% | 10.0% | 10.20% | -16.6 |
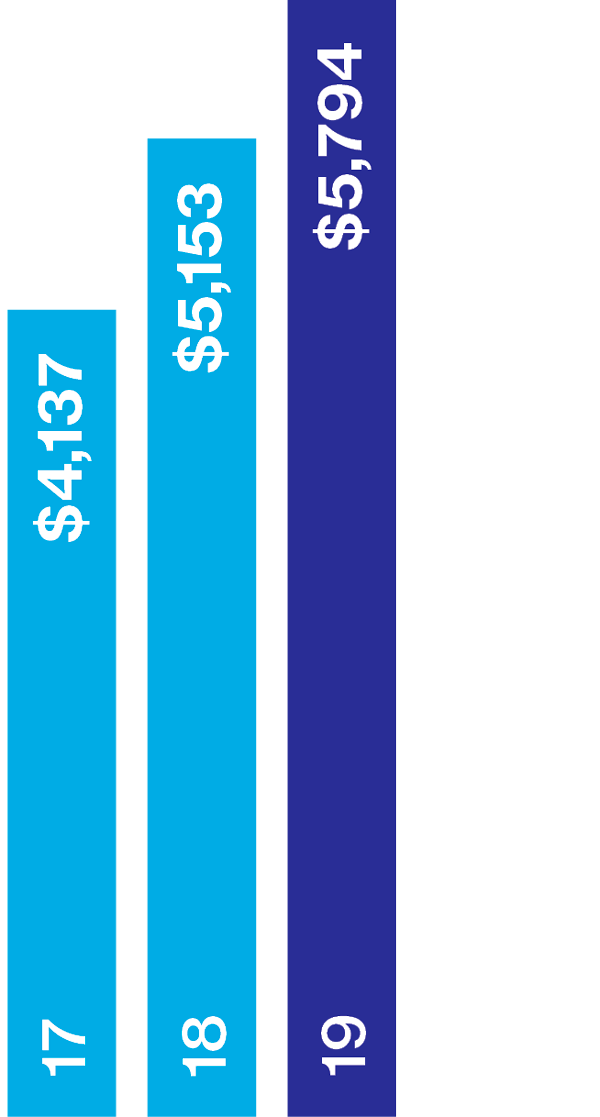

Total revenues
Millions of pesos
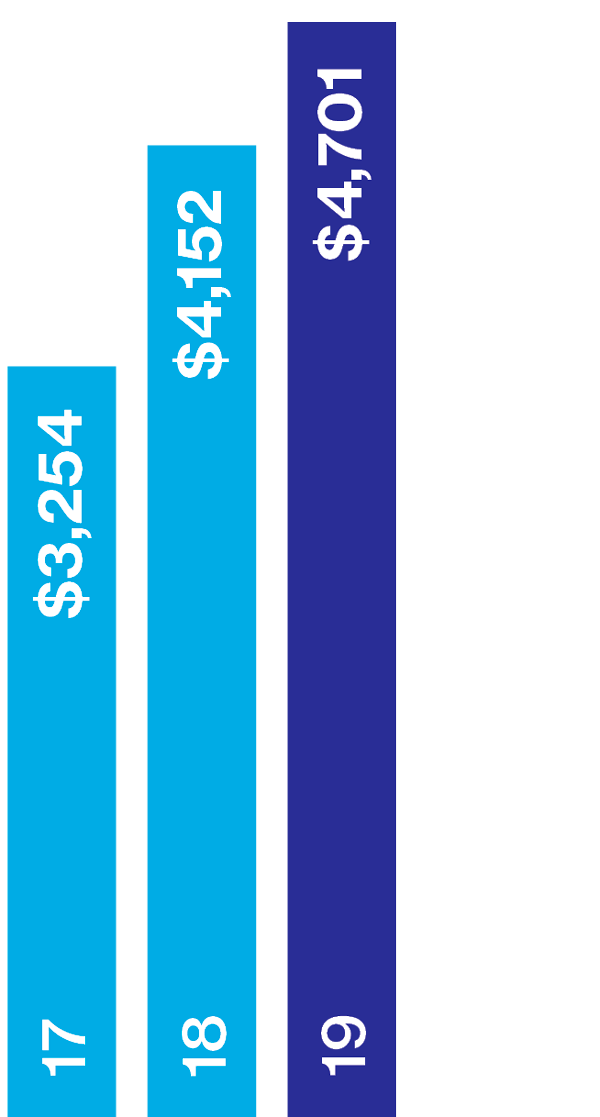

Net operating income
Millions of pesos
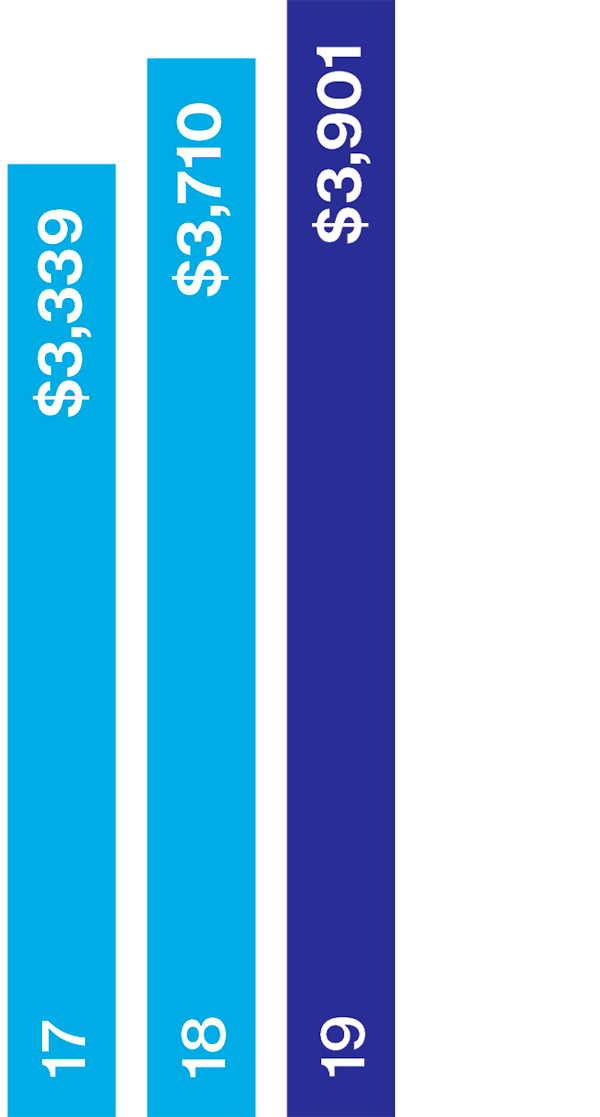

AFFO
Millions of pesos
NOI, Fixed rent and overage by property
| NOI | Fixed rent and overage | |||||||
|---|---|---|---|---|---|---|---|---|
| Properties currently in Operation |
2019 | 2018 | 2017 | Var. % | 2019 | 2018 | 2017 | Var. % |
| Retail | ||||||||
| 1. Parque Delta | 697,890,504 | 666,330,922 | 625,768,326 | 4.7% | 436,021,841 | 416,401,796 | 391,323,220 | 4.7% |
| 2.Parque Duraznos | 91,851,375 | 86,852,174 | 82,164,033 | 5.8% | 69,806,465 | 65,119,939 | 65,591,717 | 7.2% |
| 3.Parque Lindavista | 371,761,335 | 359,662,716 | 331,283,502 | 3.4% | 272,599,034 | 263,505,123 | 248,953,453 | 3.5% |
| 4.Parque Tezontle | 494,764,445 | 505,178,328 | 454,838,574 | -2.1% | 380,021,153 | 364,853,204 | 328,683,545 | 4.2% |
| 5.Parque Via Vallejo | 265,114,803 | 240,347,396 | 212,635,719 | 10.3% | 272,450,732 | 255,195,780 | 235,125,601 | 6.8% |
| 6.Parque Puebla | 286,168,794 | 236,579,993 | 25,945,659 | 21.0% | 224,488,345 | 190,600,378 | 33,700,071 | 17.8% |
| 7.Parque las Antenas | 440,946,523 | 135,905,268 | 224.5% | 341,538,255 | 119,607,254 | 185.5% | ||
| Subtotal Comercial | 2,648,497,779 | 2,230,856,796 | 1,732,635,813 | 18.7% | 1,996,925,824 | 1,675,283,474 | 1,303,377,607 | 19.2% |
| Office | ||||||||
| 8.Parque Esmeralda | 129,517,856 | 118,158,782 | 110,281,153 | 9.6% | 138,328,880 | 128,933,553 | 115,743,858 | 7.3% |
| 9.Urbitec | 56,022,298 | 49,840,413 | 45,041,934 | 12.4% | 56,199,022 | 53,789,723 | 48,730,928 | 4.5% |
| 10.Parque Virreyes | 43,449,296 | 41,632,979 | 35,384,001 | 4.4% | 45,621,684 | 44,383,357 | 38,302,659 | 2.8% |
| 11.Torre Virreyes | 609,606,707 | 586,588,137 | 472,450,038 | 3.9% | 608,522,475 | 585,401,060 | 483,792,308 | 3.9% |
| Office Subtotal | 838,596,157 | 796,220,311 | 663,157,126 | 5.3% | 848,672,062 | 812,507,694 | 686,569,753 | 4.5% |
| Mixed-use | ||||||||
| 12.Parque Alameda | 47,242,495 | 42,563,698 | 37,404,802 | 11.0% | 48,768,073 | 44,150,840 | 40,122,607 | 10.5% |
| 13.1Reforma 222 (Retail) | 175,649,008 | 160,514,807 | 141,570,633 | 9.4% | 135,558,130 | 131,986,032 | 116,351,721 | 2.7% |
| 13.2Reforma 222 (Office) | 107,300,915 | 124,178,664 | 123,121,050 | -13.6% | 114,848,174 | 129,976,365 | 131,407,742 | -11.6% |
| 14.1Toreo (Retail) | 450,472,781 | 408,463,230 | 360,229,282 | 10.3% | 385,600,619 | 355,668,440 | 314,959,467 | 8.4% |
| 14.2Toreo (Tower A) | 135,970,953 | 116,226,773 | 1,130,087 | 17.0% | 147,913,636 | 126,296,833 | 3,115,416 | 17.1% |
| 14.3Toreo (Tower B and C) | 243,556,698 | 225,318,590 | 184,407,596 | 8.1% | 257,544,249 | 244,145,953 | 197,394,881 | 5.5% |
| 14.4Toreo Hotel | 55,797,416 | 54,370,691 | 50,022,468 | 2.6% | 56,539,689 | 55,406,333 | 50,982,303 | 2.0% |
| Mixed-use Subtotal | 1,215,990,267 | 1,131,636,453 | 897,885,918 | 7.5% | 1,146,772,570 | 1,087,630,798 | 854,334,137 | 5.4% |
| Total | 4,703,084,203 | 4,158,713,561 | 3,293,678,857 | 13.1% | 3,992,370,456 | 3,575,421,966 | 2,844,281,497 | 11.7% |
Main operating indicators
| Operating indicators | 2019 | 2018 | 2017 | % Chge/pb |
|---|---|---|---|---|
| Gross Leasable Area (000’ sqm) | 891.7 | 882.1 | 771.7 | 1.1% |
| Occupancy Rate - Total Properties | 92.2% | 90.6% | 89.0% | 160.0 |
| Occupancy Rate - Same Properties | 98.2% | 98.3% | 97.9% | -10.0 |
| Average Monthly Fixed Rent per sqm | $392 | 388.5 | 386.1 | 1.0% |
| Occupancy Cost | 8.90% | 8.7% | 8.7% | 16.0 |
| Renewal Rate | 99.60% | 98.1% | 95.6% | 146.0 |
| Tenant Sales - Total Properties (000’) | $13,041,118,645 | $11,800,196,604 | $10,256,669,048 | 21.90% |
| Tenant Sales - Same Properties (000’) | $48,834 | $40,788 | $35,452 | 21.70% |
| Flow of Visitors - Total Properties | 125,613,133 | 110,167,072 | 93,784,020 | 20.30% |
| Flow of Visitors - Same Properties | 98,642,762 | 80,865,697 | 78,107,504 | 1.00% |
| Delinquency Rate | 0.32% | 0.26% | 0.53% | 6.0 |
| Rent Loss | 0.68% | 0.63% | 0.85% | 5.0 |
| Lease Spread | 5.90% | 5.80% | 13.50% | 10.0 |
Properties in Operation
| Year opened | State /Municipality | GLA m2 |
% GLA | Occupancy | Parking spaces | |
|---|---|---|---|---|---|---|
| Comercial | ||||||
| 1. Parque Alameda | 2003 | Cuauhtémoc, Mexico City | 15,755 | 1.7% | 99.2% | 308 |
| 2. Parque Delta | 2005/2016 (expansion) | Benito Juárez, Mexico City |
70,831 | 7.6% | 99.8% | 2,999 |
| 3. Parque Duraznos | 2000 | Miguel Hidalgo, Mexico City | 16,389 | 1.8% | 93.7% | 1,002 |
| 4. Parque Las Antenas | 2018 | Iztapalapa, Mexico City | 108,830 | 11.7% | 88.3% | 4,351 |
| 5. Parque Lindavista | 2006 | Gustavo A. Madero, Mexico City | 41,550 | 4.5% | 99.5% | 2,254 |
| 6.1 Reforma 222 (Retail) | 2007 | Cuauhtémoc, Mexico City | 24,291 | 2.6% | 99.0% | 1,438 |
| 7.1 Parque Puebla | 2017 | Puebla, Puebla | 71,362 | 7.7% | 78.5% | 3,404 |
| 8. Parque Tezontle | 2007/2015 (expansion) | Iztapalapa, Mexico City | 68,318 | 7.4% | 99.0% | 3,045 |
| 9.1 Toreo Parque Central (Retail) | 2014 | Naucalpan, Mexico State | 92,707 | 10.0% | 98.1% | 3,400 |
| 10. Vía Vallejo | 2016 | Iztapalapa, Mexico City | 84,619 | 9.1% | 95.5% | 4,499 |
| Retail Subtotal | 594,652 | 64.2% | 93.9% | 26,700 | ||
| Offices | ||||||
| 6.2 Reforma 222 (Offices) | 2007 | Cuauhtémoc, Mexico City | 20,397 | 2.2% | 95.5% | 288 |
| 7.2 Puebla (Hotel) | 2019 | Puebla, Puebla | 9,596 | 1.0% | 100.0% | 70 |
| 9.2 Toreo (Towers B & C) | 2016 | Naucalpan, Mexico State | 64,432 | 7.0% | 84.7% | 1,314 |
| 9.3 Toreo (Tower A) | 2017 | Naucalpan, Mexico State | 62,605 | 6.8% | 66.5% | 1,315 |
| 9.4 Toreo (Hotel) | 2016 | Naucalpan, Mexico State | 17,297 | 1.9% | 100.0% | 400 |
| 11. Parque Esmeralda | 2000 | Tlalpan, Mexico City | 34,151 | 3.7% | 100.0% | 1,636 |
| 12. Torre Virreyes | 2015 | Miguel Hidalgo, Mexico City | 67,878 | 7.3% | 100.0% | 2,251 |
| 13. Urbitec | 2009 | Miguel Hidalgo, Mexico City | 12,912 | 1.4% | 87.4% | 316 |
| 14. Parque Virreyes | 1989 | Miguel Hidalgo, Mexico City | 7,783 | 0.8% | 97.6% | 251 |
| Office Subtotal | 297,051 | 32.1% | 88.7% | 7,841 | ||
| Total portfolio in current operation | 891,703 | 96.2% | 92.2% | 34,541 | ||
| Current development portfolio (retail) | ||||||
| 15. Parque Tepeyac | — | Northeast Mexico City | 35,000* | 3.8% | NA | 2,000 |
| Retail Subtotal | 35,000 | 3.8% | NA | 2,000 | ||
| Total current development portfolio | 35,000 | 3.8% | NA | 2,000 | ||
| Total portfolio | 926,703 | 100.0% | 92.2% | 36,541 | ||
* This development has 70,000 m2, but Fibra Danhos owns a 50% stake in the project.